mana.o. On the PSI Fast cluster this has aleady been installed.
Bryan Wright should be contacted to do it on the various UVa clusters. In addition,
the PVM library version 3.4.2 or larger is required.The the PVM system to work, a few environment variables have to be defined. Here is a typical .cshrc file:
setenv PVM_ROOT /usr/share/pvm3
setenv XPVM_ROOT /usr/share/xpvm
setenv PVM_ARCH `$PVM_ROOT/lib/pvmgetarch`
setenv PATH "${PATH}:.:$PVM_ROOT/lib/LINUX"
It might be that the PVM_ROOT is at a different location, like /usr/local/pvm3.
The analyzer is compiled as normal, except that it is linked against the pmana.o
file instead of the mana.o file and the libpvm3.a
library. Following is an example snippet of the required Makefile, note the
pmana.o and the libpvm3.a statements:
...
analyzer: $(LIB) $(LIB_DIR)/pmana.o analyzer.o $(MODULES)
  $(FF) $(FFLAGS) -o analyzer $(LIB_DIR)/pmana.o analyzer.o \
  $(MODULES) $(CERNLIB_DIR)/libpacklib.a /usr/share/pvm3/lib/LINUX/libpvm3.a \
  $(LIB) $(LDFLAGS) $(LIBS)
...
When the analyzer compiles correctly, one can proceed with the next step.
[stefan@fast ~]$ pvm
pvm> add node1
add node1
1 successful
                    HOST     DTID
                   node1    80000
pvm> add node2
add node2
1 successful
                    HOST     DTID
                   node2    c0000
pvm> conf
conf
3 hosts, 1 data format
                    HOST     DTID     ARCH   SPEED       DSIG
                    fast    40000    LINUX    1000 0x00408841
                   node1    80000    LINUX    1000 0x00408841
                   node2    c0000    LINUX    1000 0x00408841
pvm> quit
quit

Console: exit handler called
pvmd still running.
In the above case, the nodes node1 and node2 have been added to the
"virtual" cluster, which can be inspected using the conf command.
I have not yet worked out a scheme who should use how many nodes. If nodes get used by two or more people in parallel, the performance drops down. So it would be better if noded are used exclusively by individuals, like node1-5 by person A, node6-10 by person B and so on.
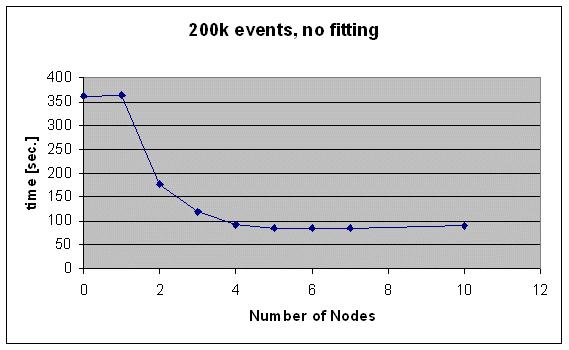
The optimal number of nodes for an analysis tasks can vary. I made some tests with and without DSC fitting. Following figures list the computation time vs. number of nodes for 200k events (a single run), without DSC fitting (/analyzer/module switches/DSC = n).

As can be seen, the time it takes for one run starts at 360 sec. ("0" nodes mean the standard, non-paralellized analyzer, and "1" means that the master analyzer which distributes the events runs on the central node and once client node does tha analysis). When adding more nodes, the time drops to about 80 sec. which are already reached using five nodes. Adding more nodes does not help because the system is then limited by the harddisk and network bandwidth.
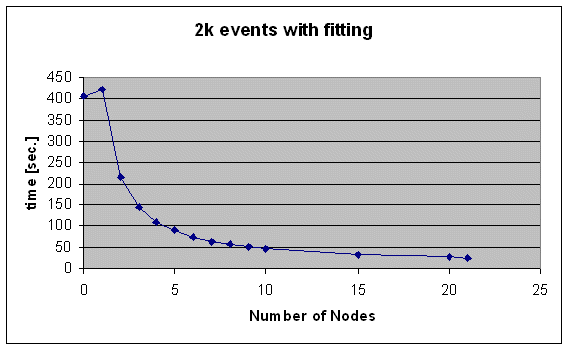
The picture is different when one uses fitting, since this is a much more CPU consuming process. Following figure shows the computation time for 2k events (1/100 of a run), with DSC fittin:

Since the system here is only limited by the CPU power, adding more than five nodes helps. But using 20 nodes, it still needs ~45min. to analyze one run, what tells me that we have to optimize the fitting algorithmus, which probably HP takes over.
Once the configuration is defined, one can leave the pvm program using the quit
command which still leaves the configuration active.
To tell the system which event to "farm" out, the GET_FARM flag needs to be put into
the analyzer request like this:
NALYZE_REQUEST analyze_request[] = {

  { "Trigger",            /* event name */
    1,                    /* event ID */
    TRIGGER_ALL,          /* trigger mask */
    GET_SOME | GET_FARM,  /* get some events, farmed under PVM */
    "SYSTEM",             /* event buffer */
    TRUE,                 /* enabled */
    "", "",
    NULL,                 /* analyzer routine */
    trigger_module,       /* module list */
    trigger_bank_list,    /* bank list */
    10000,                /* RWNT buffer size */
    TRUE,                 /* use tests for this event */
  },
/home/[yourname]/analyzer. If the
data files are in a different directory, the full path has to be entered like:
analyzer -i /data/myname/run12345.mid -o /data/myname/run12345.rzWhen the analyzer is started, it displays a notification about the number of nodes it is using:
[stefan@fast ~/analyzer]$ analyzer -i run36660.mid -o run36660.rz
Parallelizing analyzer on 5 machines
Running analyzer offline. Stop with "!"
Load ODB from run 36660...OK
run36660.mid:20671 events
Following things are slightly differnt:
n1.rz, n2.rz and so on
mcleanupto run it on all cluster machines, enter:
brsh mcleanupThe
brsh can also be used to distribute other commands on all cluster
nodes. Note that all nodes see the same disk directory residing on the central node.

S. Ritt, 17 Nov 2000