The uniformity in light output of pure CsI crystals for the PIBETA experiment was measured with a 137Cs radioactive source. The method of measurement and the results for three typical crystals are reported. It was found that this method is consistent with our 3D tomography and well suited for uniformity tests.
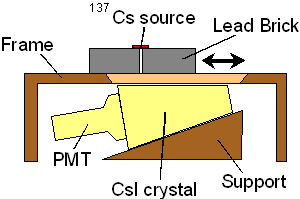
A 137Cs source was mounted on a lead brick collimator
with a size of 5cm x 10cm x 20cm and a 6mm hole. A frame of 15mm
ply wood was built to accommodate a CsI crystal with its PMT and
to move the lead collimator on top of the crystal.

Two PENT and one HEX C crystal were covered with a light tight cardboard enclosure of 2mm thickness. The PMT and the PMT base were the same as for the final set-up. The PMT was operated at 1900V. While one output of the base was terminated, the other output was fed into an Ortec 454 timing amplifier with a gain of 30 and time constants of 50ns for integration and differentiation. The same signal was discriminated at 60mV to produce a trigger. The signal was digitized with a peak sensing Ortec AD811 ADC and histogrammed.
The source produced triggers at roughly 3kHz. Each "run" consisted of ~90k events taken over approximately four minutes. Several background runs were taken without the source but with the lead brick and subtracted from the spectra which were obtained with source. It was found that the background spectra were not sensitive to the exact position to the lead brick, so one background was used for all spectra. Pedestal runs were taken with a clock trigger and used to correct the spectra. During the measurements for one crystal, the temperature variation was less than 0.3 degree Celsius.
After background subtraction, the spectra were fitted with the
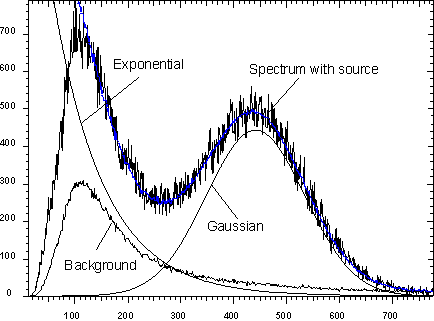
HistoManager program. Following picture shows a typical spectrum
with its background and a gaussian fitted to the 137Cs
line. To take account of the Compton edge of the 137Cs
spectrum, an addition exponential background was fitted. The center
and FWHM of the gaussian was evaluated for each spectrum.

The obtained center of the gaussian was then subtracted with the measured ADC pedestal. The statistical error was less than 0.3% in each run.
For each crystal, five points along the center axis were taken plus some points off-axis (up to +-3cm).
Following pictures show the peak centers and relative FWHM along the center axis for three CsI crystals with the serial numbers S003, S005 and S113, repectively. The result of the 137Cs measurement (left side) is compared with the corresponding data from the tomography (right side).
It can clearly be seen that there is a correlation between the peak position (left side) and the tomography result. The FWHM of the source measurement increases near the PMT, where the light output is highly non-uniform due to the optical geometry.
Following pictures show the comparison of two dimensional data between the 137Cs measurement and the tomography.
Again, a correlation between the two measurement methods is clearly visible. Note that the 137Cs measurements does not cover the full crystal area so the features at the edges in the tomography data (like near the PMT) are not fully reproduced in the 137Cs data.
The uniformity results obtained with a 137Cs source are clearly correlated to our tomography data. Not only the general trend is reproduced, but also the quantitative uniformity obtained for a central axis can be measured to some extend. Since a 0.662 MeV gamma from the 137Cs source penetrates several centimeters of CsI on average, not only the surface is probed but also the interior of our CsI crystals. Due to the lack of any tracking of individual gammas, the edge regions of the CsI cannot be probed. Only geometries where the collimated 137Cs source points perpendicular to the crystal surface produce useful results.