This document now describes which methods were applied in the off-line analysis to evaluate the waveform data.
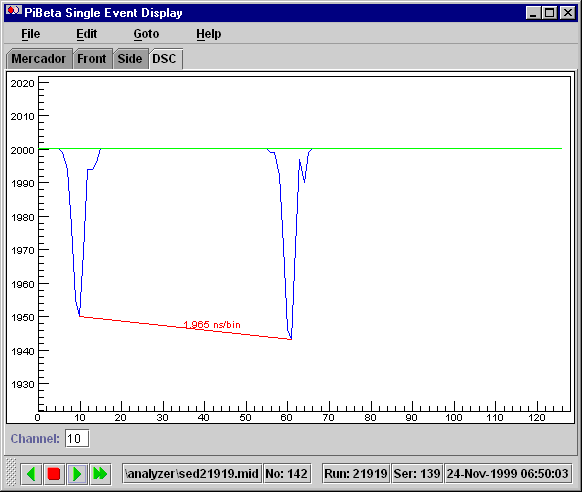
To determine the exact sampling speed, a 100 ns wide test pulse was used which was capacitively coupled to the DSC input at a rate of ~1 Hz. This pulse induced two spikes 100 ns apart, which can be used to determine the DSC speed. Following picture shows a typical event and the derived domino speed:
The exact position of the peaks was determined by fitting a second order parabola through the three points at the peaks, which gives a sub-bin resolution. To determine the current speed, all events from a run are analyzed and averaged. Since the calibration events come at ~1Hz interlaced without our normal data, the calibration runs permanently in the analyzer code and updates the calibration constants for every run. Here is a list of typical domino speeds for all sixteen channels in a given run:
                run 22370	  run 22406
channel         ns/bin     	  ns/bin

[0]             1.94106		  1.93549
[1]             2.00366		  1.99911
[2]             1.96029		  1.9561
[3]             1.99133		  1.98513
[4]             2.00226		  1.99841
[5]             2.00538		  2.00102
[6]             1.99917		  1.99499
[7]             1.96288		  1.95852
[8]             1.95804		  1.95312
[9]             2.03156		  2.02833
[10]            1.97487		  1.96807
[11]            1.96509		  1.96134
[12]            1.94905		  1.9447
[13]            1.98898		  1.98396
[14]            2.13812		  2.13358
[15]            2.07931		  2.07277
The two runs were taken one week apart so one sees that the domino speed is pretty
stable over time. The maximum deviation is 0.3% which corresponds to 0.4ns for the
average peak, which lies about in the center of the waveform at 128ns.
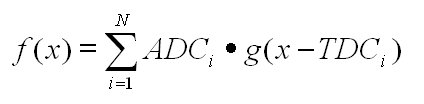
where g(x) is the system function for a given channel and f(x) is the function which is fitted to the waveform by varying ADCi and TDCi in order to minimize the chi^2 of the fit.
Following picture shows a typical system function derived by averaging over > 100,000 events which contained only one hit in that particular channel:
Note the ripple around t=175ns which corresponds to a signal reflection due to imperfect 50 Ohm termination in the trigger branch of our electronics. This ripple is present in every event and correctly taken care of by including it in the system function, while other techniques like multi-hit TDC's would identify this peak falsly as a real hit. The system functions for all channels are stored in the file waveform.dat in the analyzer directory and must be present to sucessfully run the analyzer.
Following displays show some fitted waveforms using this system function. Note how well the multiple hits can be fitted. The blue line is the originial waveform. The "gap" between separated hits come from the front-end zero supression, which only stores the waveform around real hits. This region with y=0 is of course not taken into account when doing the fit, which is displayed in green. Red circles indicate the peak value. The x-axis is not yet calibrated, so one unit corresponds to ~2ns.
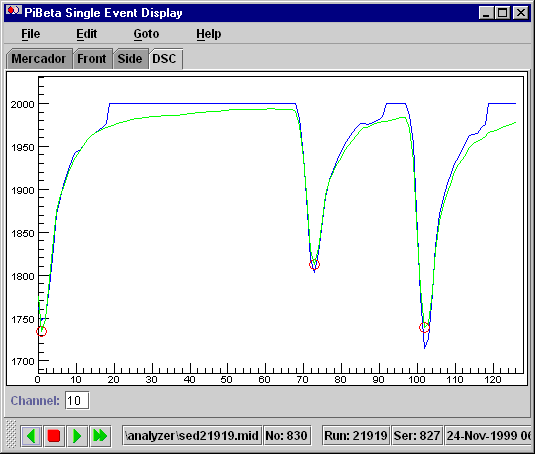
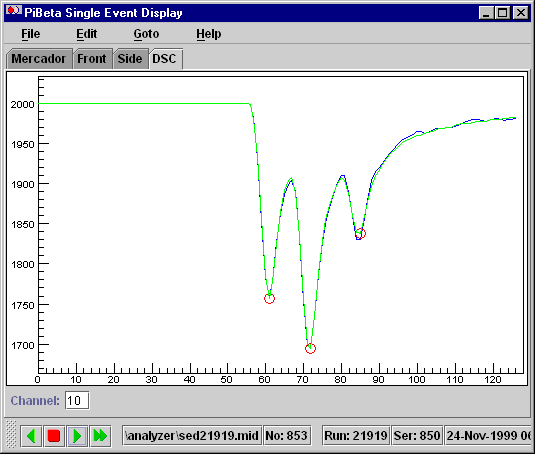
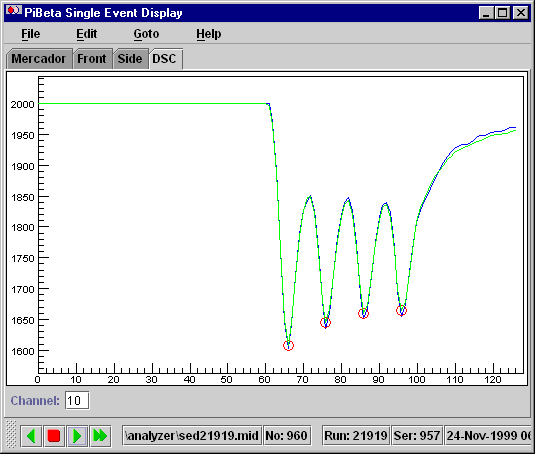
The used channel in these figures is the active degrader, which shows a monoenergetic line of ~20MeV for degraded pions. The pile-up shown in these figures comes from the 20ns beam structure of the PSI accelerator. We used a stopping rate of ~1MHz, which leads to a probability of ~1/50 for having two adjacent pions.
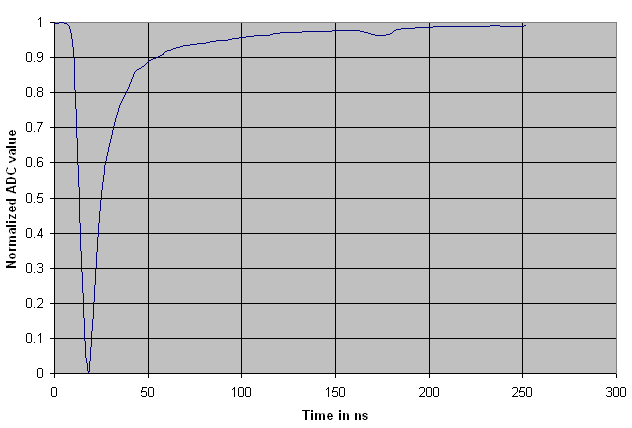
Pane 4 shows DSC ADC vs. DSC TDC data. There is no visible dependency, as it should be, unlike at the CAMAC ADC data.
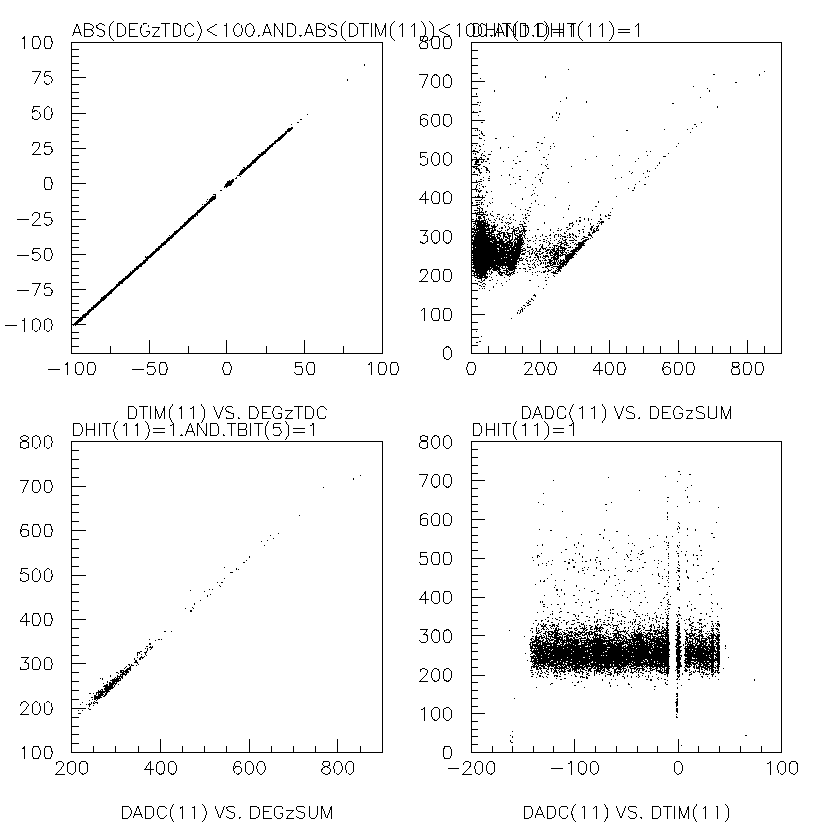
For a closer look at the timing resolution, pane 1 has been enlarged:
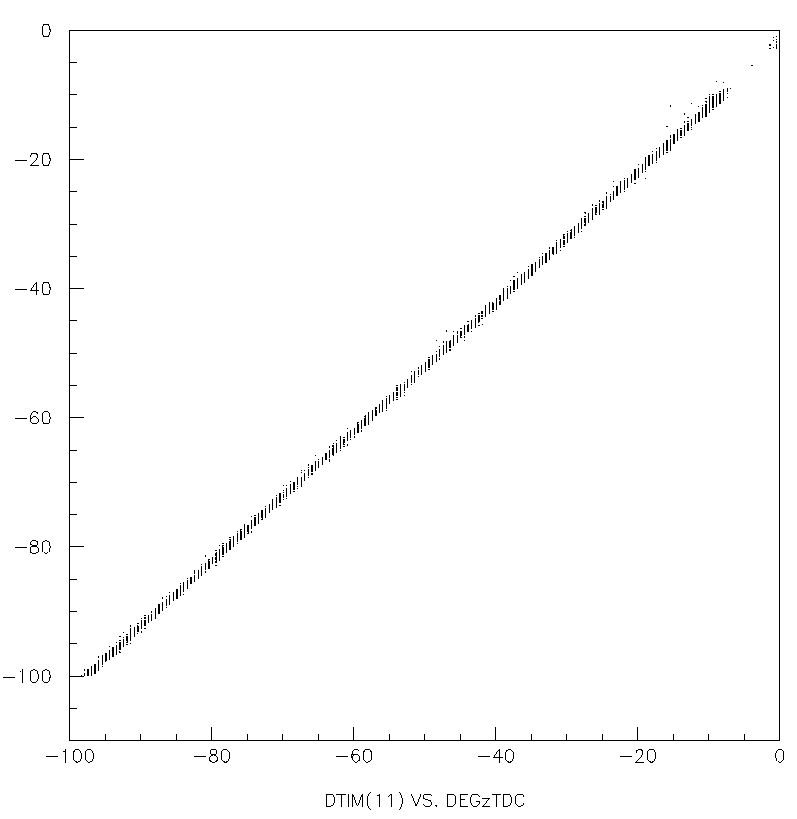
One can see the 0.5ns resolution of the LRS1877 TDC's as vertical bands and some time jitter between the two variables. The value DSC TDC - FASTBUS TDC has a distribution with a sigma of 0.4ns which comes mainly from the limited LRS1877 TDC resolution. To make a more careful study of the DSC timing resolution one would need TDCs with a better timing resolution. A rule of thumb is that with a sampling speed of 2ns one can obtain a time accuracy of 0.2ns, taken into account the full waveform during the fitting process.

S. Ritt, 31 Jan 2000