


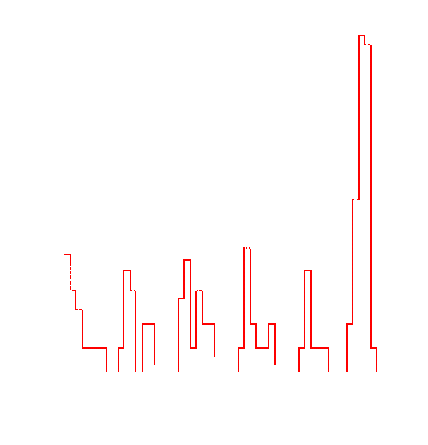
Figure 5.6: Timing spectrum using the prompt trigger. Time increases to the left with the TDC start occurring at approximately channel 100. The 20 ns beam structure is clearly seen caused by particles in beam buckets subsequent to the one which created the trigger.
which account for the specifics of the experimental method. Most of these
corrections are needed to account for the µ+ ->
e+ n n (hereafter referred to as Michel) events not recorded
by our detector. These include a factor Rts to match
the amplitude of background and signal spectra, a factor Rlh
to account for all the low energy Michel events not recorded by the
high-threshold trigger, a correction f-1 for the
experimental gate timing,
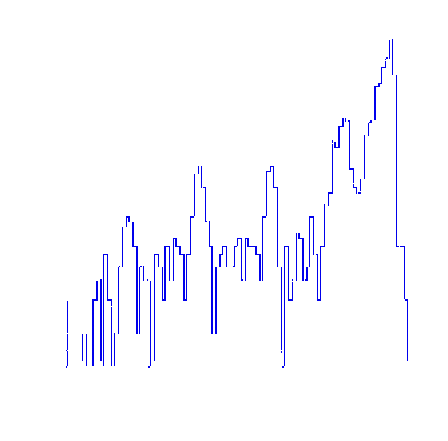
Figure 5.7: Timing spectrum for prompt events in the DPG. Time increases to the left with the TDC start occurring at approximately channel 100. The 20 ns beam structure is present similar to figure 5.6.
and a factor Rlo low energy tail correction. A description for each term and how it was obtained is presented below.