


The most direct approach to form a cluster would be a sum of the overall energy content of the crystals. But then, whenever a shower develops close to the edge of the array, also events that do not deposit a major fraction of energy within the detector would contribute. This results in an exponential tail to the left side of a peak. In order to cure that problem the outermost crystals should veto shower losses. This has to be achieved without omitting energy if the outermost crystals only contain a small fraction of the deposited energy while the major contribution comes from inner crystals. Hence, the vetoing requires an energy threshold to decide when to sum and when to drop. A plot of peak position and FWHM against the energy threshold gave a clear result for the needed threshold values. This was shown using simulations of different energy photons that were uniformly distributed over the array of 44 CsI crystals. Figure 7-10 shows the result for 129 MeV photons.
Finally, a criterion is needed to determine whether the deposited energy in the calorimeter originates from a single particle, radiative decays or arbitrary coincidences. To this end a software algorithm should find the optimum set of crystals to add for each event rather than establishing fixed clusters. This routine needs to determine which crystals will be included in the sum accordingly to the shower maximum and the shower spread and, furthermore, if an event should be neglected. It would work similar to the clump finding algorithm described in section 5.1. In order to make a decision, knowledge about the normal shower spread within the calorimeter is needed.
Energy loss in matter (dE/dx) comes along with two elementary processes, ionization and radiation loss. The critical energy Ec[31] of a material usually is defined by the energy where both processes have the same magnitude, hence
 .
.Then the position of the shower maximum can be modelled to be ln(E0/Ec)X0, where E0 is the shower energy and X0 the radiation length [Ore88].
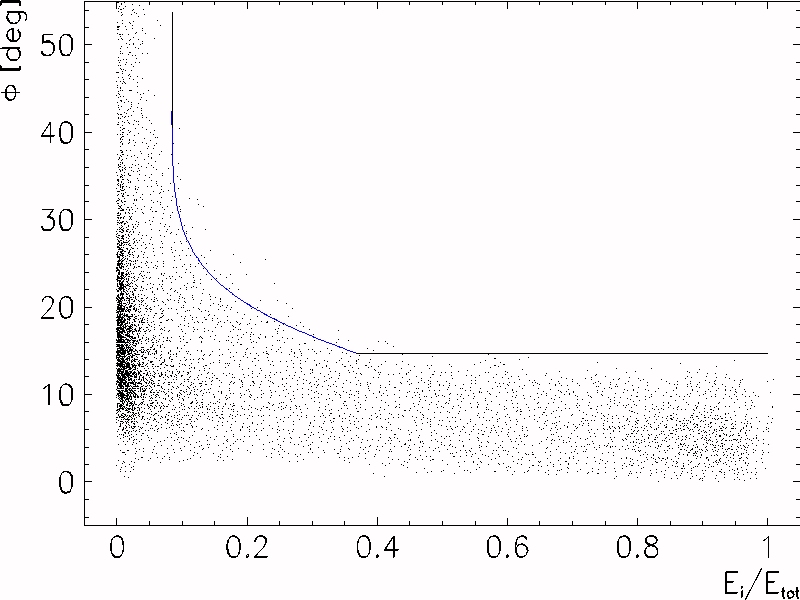
An energy distribution function df( f )/dcos( f ) can be defined in analogy to the energy loss where f( f ) represents the energy function and f the distance of a point within the array to the trajectory of the incident particle in spherical coordinates. In order to obtain f a simulation with 70 MeV photons that were thrown uniformly onto the array of CsI crystals was carried out. Then the position of incidence was recorded as well as the total deposited energy. For each crystal the angular distance to the point of incidence was plotted against the fraction of deposited energy. This results in a 2-dimensional plot representing the energy distribution of electromagnetic showers, shown in Figure 7-11.
The discrimination function f has a range of values among (0,1). Then the decisions are as follows: if f<0 the energy belongs to main shower, if f>0 radiative decay or two particle detection is considered. A fit function with three free parameters was selected in order to contain 98% of the distribution[32], which is indicated by the line in Figure 7-11. This function turned out to be
 .
.
It is used to allow summing over the appropriate set of crystals.
 .
.
Figure 7-11 Scatter plot of the relative energy spread within the calorimeter. Plotted is the frequency of a certain distribution of angular distance f of the i-th crystal to the shower centroid against the relative energy content qi=Ei/Etot. The solid line indicates the given threshold function with the additional constraints: q lower than 0.85 and f less than 14.7°. One can notice that the majority of crystals close to the incidence point (near 10) contribute only with a few percentage of energy. The points with Ei/Etot between 0.75 and 0.95 originate from individual crystals that carry the major fraction of total energy.
The algorithm for the summing follows the steps given in the description of the clump finding routine (section 5.1.1). The input to this routine is the energy deposited in the entire detector plus the individual energies and the coordinates of each crystal. With this information the routine sorts all crystals according to the energy content, starting from the one with the highest fraction. This crystal defines the initial cluster with its position and energy. All other crystals that are inside the area defined by the discrimination function are added to this cluster. The cluster's energy and position then are recalculated. By this, unlikely shower distributions, e.g. due to pair conversion in flight, and accidentals[33] can be excluded which also results in a slightly improved energy resolution. The summing routine led to a reduction of 6.3% FWHM before and 5.2% FWHM after cuts for 129 MeV photons and 7.6% and 5.8%, respectively, for 70 MeV photons. The determination of the detector acceptance takes care of that difference.
[32] The application of the obtained threshold function to simulated positrons of the same energy resulted in an efficiency of 97%, which can be explained by the somewhat larger shower spread.
[33] For this measurement accidentals includes simultaneously detected photons and neutrons within the same region of the CsI array.