


In brevity: The routine shall be capable to decide about the number of tracks and its energies rather than blindly sum over modules that contains energy deposition.
The principles of the algorithm are as follows: 1. The fraction of the total calorimeter energy for each crystal exceeding the minimum energy threshold as well as the position are stored in a four-dimensional array.
2. The array is sorted with the highest energy placed first.
3. The first entry defines the centre and energy of the first cluster. Each succeeding entry joins this cluster if its angular distance from the cluster centroid is lower than the a chosen threshold value and the cluster centroid is recalculated. When the entry has a sufficient distance from the first cluster a new cluster is generated.
4. All remaining entries now either join the first or second cluster. The generation of further clusters is possible according to the threshold conditions.
5. In a second pass the generated clusters must be approved by repeating steps 1 to 4 with the cluster variables replacing the crystal variables. Here also additional criteria are defined, such as a threshold energy for a cluster or the requirement that a cluster must consist of two crystals at least. A cluster that fails the test is associated with the nearest cluster.
6. Finally, the routine saves the information on the cluster's energies, positions ( q , f ) and the allocation of the crystals contained in these clusters.
The free parameters have been adjusted using a simulation of p +->e+ n e g in order to obtain a highly efficient clump identification. Despite the relatively good angular resolution of better than 4° it was found that the centres of two clumps have to be more than 15° apart to be distinguishable which is just above the average angular distance between two crystal midpoints. The clump finding efficiency is defined by the fraction of double tracks that were identified with the specified thresholds. Requiring a `clump distance' of 20° and at least 10% of the deposited energy in the second cluster an efficiency of 99.8% is achieved. But, this high efficiency emerges at the cost of misinterpreted single tracks. This was found by a simulation of 70 MeV positrons that were distributed uniformly over the sphere, whereby an unacceptable misidentification of 19% was stated.
During the development process the simple approach of a distance threshold has been replaced by a threshold function. This function models the energy-angle relation. Interestingly, the curves of constant acceptance are similar to the energy deposition plot for monoenergetic positrons or photons. This plot presents the energy of a certain crystal divided by the overall energy deposition as a function of the angular distance[22] of that crystal to the shower centre is drawn (Figure 7-11). Now a function can be obtained which includes, for instance, 98% of the shower energy under the graph. The function
gives the threshold constraint for a given value of q, where q is the fraction of deposited energy in the crystal of interest. A value above that threshold then indicates the presence of another clump. According to Oreglia [Ore88] the parameters of the threshold function can be related to the shower profile dimensions and the material dependent critical energy[23] EC. The obtained parameters are a compromise of high efficiency for radiative decays, low contribution of misinterpreted single particle induced showers and good accuracy. An overall efficiency of 95.6% with a misidentification rate for single particle showers of 9.1% was the best compromise that could be reached.
With the above discrimination function and additional cuts for an energy fraction of 2% and an angle of 20° the applicability of the algorithm was tested by trying to resolve radiative events. During the 1996 beam period a 116 MeV/c p + beam was stopped in the above described plastic target. The p +->e+ n e trigger was investigated using an array of 44 crystals and a part of the hodoscope. Michel events were prescaled by a factor of 100 for a reduction of the count rate to an acceptable level.
In summing over the calorimeter modules it was required that a large fraction of energy was deposited within the innermost 18 crystals. In addition a positron signal in the hodoscope was required. The systematical errors due to the cuts are expressed through the determination of the acceptance, since the same computer code was used to analyze both data and simulation. The efficiency corrections and rounding errors are assumed to be precise to ±2 counts.
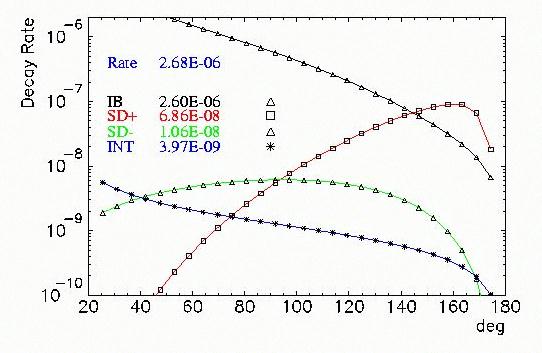
Out of 3.4*106 recorded events 18649 contained a well separated second cluster exceeding 5 MeV deposited energy. A correction for positron conversion in target and hodoscope was not applied, since the conversion probabilities for the positrons from p +->e+ n e and p +->e+ n e g are nearly identical. A small difference due to the lower positron energy in the case of radiative decay does not contribute significantly to the overall error. After applying cuts in order to select p +->e+ n e events [Law98] one finds the a total number of 59738 from which 891 were identified to be radiative. Using a simulation of radiative p +->e+ n e with the weightings accordingly to [Bry82], for the given detector geometry and used cuts an acceptance of 0.0393 for >5 MeV photons was determined. This has to be compared with the p +->e+ n e acceptance of 0.0622. An error of 12% comprising the statistics of accepted events and cut inefficiencies was determined. So one settles at a p +->e+ n e g decay rate for photons larger than 5 MeV of (2.90±1.2)*10-6. A calculation (Figure 5-3) gives 2.7*10-6 and therefore shows good agreement. This numerical calculation was successfully cross-checked with the results given in the publications listed in Table 5-3. The error of 1.2*10-6 comprises a statistical error of 0.9% and a systematical error (which also includes the uncertainty of the p +->e+ n e decay ratio of 4*10-7) of about 40%. The relatively high number is to be explained due to the uncertainties in the determination of the acceptances and the number of normalization events; the systematical A notable reduction of the overall error is to expected with the PiBeta detector due to its large acceptance and a planned high number of events. Then a detailed comparison of simulated and measured events, especially in a kinematic region with lower probability, can be achieved. Additionally, the presence of the entire charge tracking modules in combination with an accurate determination of the number of p +->e+ n e events will reduce the systematic error.
After subtracting the of p +->e+ n e( g ) events, mainly µ+->e+ n eµ( g ) remain in the data sample. Using a normalization to the number of ordinary Michel decay events[24], one obtains a rate of (1.3±0.46)% for µ+->e+ n eµ g for photons exceeding 5 MeV. Owing the high number of counts the statistical error is at 0.9%. The error in determine the acceptance was determined to be 12% by recording the number of weighted accepted events from a GEANT simulation. Rather than increasing the number of simulated events, the presence of a large acceptance calorimeter will decrease this source of uncertainty. Eckstein and Pratt [Eck50] give a BR for µ+->e+ n eµ g / µ+->e+ n eµ of 1.9% for photons exceeding the energy of 10 electron masses. We conclude that the right order of magnitude was obtained by simply applying the clump finding routine to our data. The main source contributing to a discrepancy is likely the presence of unsuppressed background, i.e., p +->µ+ n µ g .
With the application of the clump finding routine to the problem of radiative decays it was shown that a reconstruction of trajectories can be done reliably. The interesting physics behind the radiative decays can not be treated due to the low event statistics and the kinematic limitations of the 44-crsytal apparatus. As can be seen in Figure 5-3 the structure dependent terms become prominent only at higher relative angles - and thus lower probability -, which would allow the determination of pion form factors or g =FA/FV, respectively. Further development is necessary to exclude more of the ambiguous events, labelled `misidentified', because this results in a relatively high correction factor. A neural network algorithm is considered. Nevertheless, the obtained results lead to the conclusion that the PiBeta detector will be an excellent tool for a more precise determination of the p +->e+ n e g decay rate, the more so since high statistics planned. The use of the full sphere furthermore enables a cut on the proper kinematic region and thus a more precise determination of FA is possible[25]. The vector form factor FV accordingly to CVC Hypothesis is 0.0259±0.0005 [PDG98]; in a PSI experiment [EGL89] it was determined to be 0.023.
[23] see section 7.4 for the definition
[24] The Michel trigger was prescaled by a factor of 100.
[25] The actual value is quoted as 0.0116±0.0060 [PDG98].