 's,
's,
 and
and
 decays.
However, at the time of the test run, only twelve calorimeter modules were
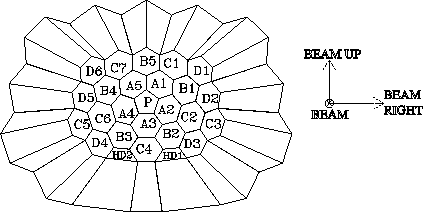
delivered. The twelve crystals consisted of one pentagon, four hexagon A's,
two hexagon B's, three hexagon C's and two half-hexagon D's.


For the test run of 1993, twenty-five crystals were ordered from Bicron
Corporation with the plan to build a sizable array with clusters and to set-up
two opposite groups of modules with the objective to test the performance
of a subsection of the calorimeter against monoenergetic beams of  's,
's,
 and
and
 decays.
However, at the time of the test run, only twelve calorimeter modules were
delivered. The twelve crystals consisted of one pentagon, four hexagon A's,
two hexagon B's, three hexagon C's and two half-hexagon D's.

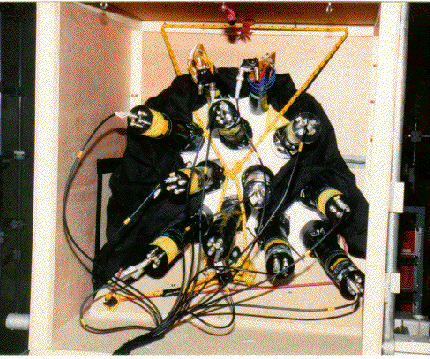
Figure: The configuration of
the twelve modules used during the test
run. The array was supported on the sides and the bottom by wooden plates and
modules, and sealed up in a dark box to be light proof.

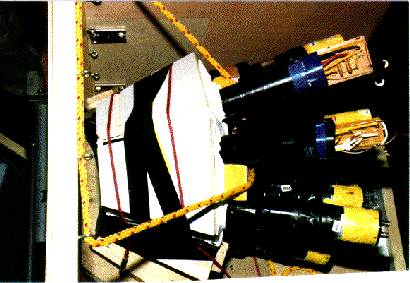
Figure: The array of CsI crystals
with sections of the box and the support
structure. The PMT's and the bases are also shown. This view from downstream
of the beam does not show the demarcations of the modules due to the white
teflon covering the rest of the back faces, and the protective black cloth.
They were all
polished and wrapped according to the result of the surface treatment studies,
i.e., three layers of teflon and black paper at the front faces. Moreover,
the half-hexagon D's were each viewed by 2-inch XP2020Q PMT's with quartz
window while the other crystals were each read out with 3-inch EMI 9814QB PMT's
also with quartz window. The PMT's were glued to the back faces of the modules
(see chapter 7) which were then arranged in the configuration shown in
figure  in a box. The box which enclosed the array, was
later positioned onto the beam line such that defocused parallel beams of
positrons
of 10, 20, 30, 50 and 70 MeV/c were incident on the array at the front faces.
The side of the box that the beam traversed before striking the front faces of
the array, was made of a thin black paper in order to minimize energy
losses and multiple scatterings and consequently the beam divergences. The
support system of the array and part of the box are displayed in
figures
  and
and  .
.

Figure: A top view of the array showing some of the wooden
plates used for support, parts of the box and some of the back faces with PMT's and
bases. This was before the box was sealed and set up along the beam line.
The beam line arrangement was
that of figure 3.6 except for the following: one of the MWPC's and the counter
S1 were removed. The side of the box which directly faced the beam was 85 cm
away from the last the quadrupole triplet. The box was first set up such that
the central trajectory of the beam passed through the common edge of B1, A2
and A3 (see figure  ). However, because the size of the beam was
not big enough to cover the entire front faces of the crystals, different runs
were performed with the box rotated or translated with respected to its
original position. One of the MWPC's shown in figure 3.6 was placed right in
the front of the box for cuts on the regions of the front faces irradiated by
the beam. The event trigger was simply the scintillator S0 in coincidence with
the ``OR'' of the modules, i.e.,
  , with
 determining the timing. The gain matching
procedure was performed on-line and off-line with the 10 MeV/c data since at
that energy, the positron showers are contained in the individual crystal
volumes so that the 10 MeV peaks were very sharp and well defined in all twelve
ADC spectra.
The data taken at various beam momenta were compared to simulations. In this case also the Geant simulation package was used. The array of twelve calorimeter modules was defined and positioned in the simulation code as it was during
the data taking process. This was a simplier task since the array was a subsection of the entire calorimeter which had already been described in the Geant simulation code as explained in section 7.4. The beam parameters were also simple to account for because the beam was a parallel, defocused beam with monoenergetic positrons. The positrons were thrown into the central region of the array in order to avoid leakage of the shower through the lateral surfaces, a leakage which would have worsened the energy resolution. In the entire calorimeter, because of its spherical geometry and the presence of the edge vetoes, this lateral leakage of the shower would not be a problem. During the data analysis, the central region of the array was selected with cuts in the MWPC. For the simulations to be realistic and comparable to data, the calculated deposited energies in each crystal were smeared by a Gausssian
function whose standard deviation combined the effects
of light collection non-uniformity and photoelectron statistics in quadrature. For
an event i, if the calculated energies were  with j=1,12, the
smeared energies
  were obtained as:

where Gauss(iseed) was the function that randomly generated a Gaussian distribution of mean zero and standard deviation one.

Figure: The responses of a subsection
of the calorimeter to monoenergetic
beam of positrons of 70, 50, 30 and 10 MeV/c. The calculated responses with
180 photoelectrons per MeV and  light collection non-uniformity show
excellent agreement with the data. The measured energy resolution at 70 MeV/c
(the
  's from
  have
have
 ) was 5.6 MeV full width half maximum.
NPM and LNU were
respectively the measured number of photoelectrons per MeV and the light
collection non-uniformity in percentage. Previously during the run,
180 photoelectrons per MeV were measured for the CsI crystals, and a light
collection non-uniformity of  standard deviation was inferred from the
analysis of the surface treatment data as shown in figure
  .
The data and the simulations show excellent agreement for 70, 50, 30 and
10 MeV/c. The measured resolution at 70 MeV/c was 5.6 MeV. This result is of
particular importance since it indicates the energy resolution of the
calorimeter. The data at 20 MeV/c did not include MWPC information due to a
problem during the data taking. For this reason, the data at 20 MeV/c could
not be compared to simulations in the same way as the data at the other beam
momenta.
During the test of 1994, the array consisted of twenty-six CsI modules. By that time,
forty-seven calorimeter modules had been delivered and the twenty-six were selected
on the basis of their fast to total ratios and on their dimensional accuracies. The
crystals were polished and wrapped in three layers of teflon and one layer of
aluminized
mylar with black paper at the front faces. After the wrapping, the photomultiplier tubes
were glued at the back faces of the modules. Two-inch XP2020Q with a PSI base were
used for the HD's while the other shapes were viewed by three-inch EMI 9822K PMT's
with a standard CERN base or EMI 9821QB PMT's with a UVA base. The gluing process
took place in a special apparatus which held the crystals and the PMT's, and
allowed the PMT's to be glued on the centers of the back faces so that the axes of
the modules coincided with those of the PMT's (the axes of the HD's and the vetoes
do not pass through the centers of their front and back faces; for these shapes,
the crystal axes do not coincide with the PMT axes) . The glue consisted of
 layer of silicon elastomer (Sylgard 184).
Three days later when the glue had assumed its normal strength, the crystal
were tested in the tomography apparatus. In the meantime, the arrangement of the crystals
in a light proof enclosure was designed. A special climatization apparatus was
constructed to monitor and control the temperature and the humidity inside the enclosure.
The climatization system consisted of an air-conditioning device connected to the
enclosure via a box which served as a heat exchanger. Seven temperature and humidity
sensors were installed inside and outside the enclosure and read out periodically with
the data. The relative positions of the crystals and their types are shown in
figure
  and a view of the experimental arrangement is shown in
figure
  . The active target and the degrader were removed and the light
proof enclosure was positioned along the beam line so that the central beam
trajectory coincided with the body axis of the pentagon.

Figure: The array of twenty-six
calorimeter modules used during the test run of
1994. The array was set up in a closed box with a special climatization apparatus
to control the temperature and the relative humidity within the box. The
parallel defocused beams of positrons and electrons were incident on the front
faces of the modules and the central beam trajectory passed through the center
of the pentagon.
Defocused parallel
beams of positrons and electrons of 10, 20, 30, 50 and 70 MeV/c were incident
upon the front faces of the modules. The beam intensity was kept relatively low,
 , to avoid radiation damage to the crystals.
The event trigger was
  .
.
The energy calibration required correct pedestal subtractions to establish the
energy zero for  . The analysis of the data on an event by
event basis revealed that the crystals had correlated pedestals for each event:
they were either all negative, nearly zero or all positive. This effect was
amplified 20-25 times in the
  . Further analysis showed that
the common noise problem was related to the three different types of PMT-base
combinations used for the read out: excellent pedestal correlations were observed
between crystals of each PMT-base group. Consequently, a second software pedestal
subtraction algorithm was worked out for the three PMT-base groups, and the noise
correlation problem was resolved with a good fix on the energy zero for
 .
.
The data at 10 MeV/c could not be used for the gain matching because the array was much bigger and all the crystals were not uniformly covered by the beam.

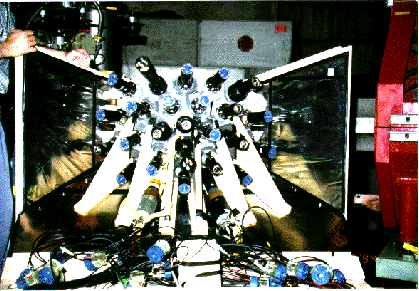
Figure: The array of twenty-six calorimeter modules seen from
the back. The PMT's, some bases and the wooden support structure are shown. Sections of
the box enclosing the modules are also visible. The red cylinder on the right is the
quadrupole triplet of the  beam line.
Consequently the 10 MeV positron peak was not clearly defined in all the
twenty-six ADC spectra. The gain matching was done with the
endpoint of the Michel spectrum in which case a degrader and a target counter were
set up along the beam line, the box containing the crystals was rotated ninety degrees
out of the beam line and placed such that the front face of the crystals were 26 cm from
the center of the target. The beam channel was switched over to select 116 MeV/c
 's and the cascades
  were detected in the
array. Prior simulation of Michel events had indicated that the Michel endpoint was the
same in all the crystals. The calibration was also done at 20 MeV/c by changing
the trigger
  to
to  for
the module i (i=1,25) and looking to the
  spectrum. The ambient
temperature in the experimental area varied within band of
  with a mean of
  over a period of two days. In the closed
box the temperature was maintained at
  with a spread of
 over the same period of time. This translated into
gain variations due to temperature fluctuations of the order
  .
.
After the tests with monoenergetic positrons were completed, the polarities of the magnets and quadrupoles were reversed to select negative particles, mainly electrons, using the same momenta as for the positron measurements. A difference between the responses of the array to positrons and electrons is expected because of positron annihilations with atomic electrons. When the resulting two photons are detected in the array, the total energy is increased
by  MeV, the electron and the positron masses.
The data at 70 MeV/c were used for gain calibration during the off-line analysis.
Twenty-five histograms of  were defined one for each crystal:
for the crystal
  , the corresponding
  was
defined such that the module
  received a significant portion of
the shower energy. From Monte Carlo simulation of the shower spreadings (section 7.4),
it is known that if hit centrally, one module will receive
  of the shower energy,
and three crystals receive most of the shower. This gain calibration method is therefore
based on the events for which the total shower is contained within the array. The 70 MeV
peaks were well defined in the twenty-five
  spectra and the peak
channels were used to calculate the gain correction factors by which the individual ADC
spectra were multiplied. This operation resulted in new
  spectra and
gain correction factors. The process was repeated until the 70 MeV peaks fell in the same
channel. The energy resolution measured at 70 MeV/c was 4.2 MeV FWHM. This result
represents a
  improvement over the 1993 result. This improvement is attributed to
a better wrapping method, a good control of the temperature and the humidity within the
box, the quality of the crystals and the size of the array. The results of the analysis
are shown in figures
  and
and  .
.

Figure: The measured line-shapes of the response
of the CsI array to monoenergetic
positrons of 70, 50, 30 and 20 MeV/c. Data are compared to simulations with
excellent agreement. Due to the high discrimination threshold, the data at 10 MeV/c
did not exhibit the full spectral response of the array. The resolution at 70 MeV
is 4.2 MeV FWHM, a substantial improvement over the result obtained in 1993.

Figure: The response of the array to electron
beams. The expected difference
between the positron and the electron responses is due positron annihilations with
atomic electrons. However, the 1.02 MeV increase in the total energy coming from
the annihilation processes is not observed because of photoelectron statistics and
light collection non-uniformity.
The data were compared to simulations with excellent agreement. The simulation code was the same one used for the 1993 data with the appropriate modifications regarding the number detector modules and their relative arrangements with respect to the beam.
The CsI array also was used to detect  events in order
to test the performance of the calorimeter with a known pion decay channel of interest to
the experiment.


