decays are of prime importance to the pion beta
experiment because, as explained in chapter 7, these events are used for
normalization of the pion beta processes. Therefore, the pion beta
experiment will not only measure the branching ratio of pion beta events
but also that of
decays are of prime importance to the pion beta
experiment because, as explained in chapter 7, these events are used for
normalization of the pion beta processes. Therefore, the pion beta
experiment will not only measure the branching ratio of pion beta events
but also that of  decays. With twenty-five
detector modules, a fraction of the calorimeter (
decays. With twenty-five
detector modules, a fraction of the calorimeter ( ) was put
together with five overlapping clusters (shown in table
) was put
together with five overlapping clusters (shown in table  ) to make
a single arm trigger. The beam line set-up consisted of a 4 cm active degrader (S1), a 5 cm active
target (S2) and the box containing the calorimeter modules as shown in
figure . A very thin (0.3 cm) plastic scintillator counter
was placed in front of the array and used as veto for hadronic processes.
) to make
a single arm trigger. The beam line set-up consisted of a 4 cm active degrader (S1), a 5 cm active
target (S2) and the box containing the calorimeter modules as shown in
figure . A very thin (0.3 cm) plastic scintillator counter
was placed in front of the array and used as veto for hadronic processes.

Table: The cluster definitions
during the test run of 1994. There was only one
supercluster which was the entire array. These definitions were not exactly the
same ones presented in section 7.4.3. However, the scheme was the same, i.e.,
each module was shared at most three times. Electronically, the PMT signals were
split the number of times they were shared and sent to the adders where the cluster
and supercluster signals were produced with a high and a low discrimination levels.
The stopped pion was defined as the coincidence between the beam counter S0 (see
figure 3.6 where S0 is the scintillator counter located behind
the lead collimator), the active degrader S1 and the RF, timed appropriately for
pion selection:  . The stopped pion initiated a
delayed pion gate (D
. The stopped pion initiated a
delayed pion gate (D G) of 60 ns during which the
 decays were registered as the coincidences
 . The signal
 was the supercluster signal --- with high discrimination
level but with the timing of the low discrimination level signal which enabled
a good timing resolution and the elimination of some prompt events which might
otherwise have slipped into the D
was the supercluster signal --- with high discrimination
level but with the timing of the low discrimination level signal which enabled
a good timing resolution and the elimination of some prompt events which might
otherwise have slipped into the D G --- obtained as
the ``OR'' of the five cluster signals.
G --- obtained as
the ``OR'' of the five cluster signals.

Figure: The
beam line set-up to measure  decays.
116 MeV/c
decays.
116 MeV/c  's traversed the plastic scintillator degrader and stopped
within the active target.
's traversed the plastic scintillator degrader and stopped
within the active target.  decays were detected
in the array of twenty-five crystals which subtended
decays were detected
in the array of twenty-five crystals which subtended  of
of  solid angle. The concrete shielding and parts of secondary beam channel in
the
solid angle. The concrete shielding and parts of secondary beam channel in
the  area are also shown. Behind the wooden box of CsI detectors,
is the climatization apparatus.
area are also shown. Behind the wooden box of CsI detectors,
is the climatization apparatus.
The low and high discrimination levels were set at 3 MeV and 25 MeV respectively. The
high discrimination level eliminated a significant fraction of the accidental Michel
events and reduced the computer dead time. The absence of the prompt veto,
 which was provided by the S1 counter, led to the
domination of the spectrum by prompt events. The electronic diagram is shown in
figure with the trigger for
which was provided by the S1 counter, led to the
domination of the spectrum by prompt events. The electronic diagram is shown in
figure with the trigger for  events.
However, data were also collected for prompt and Michel processes, in which
case the event trigger was modified to
events.
However, data were also collected for prompt and Michel processes, in which
case the event trigger was modified to  and
and  respectively.
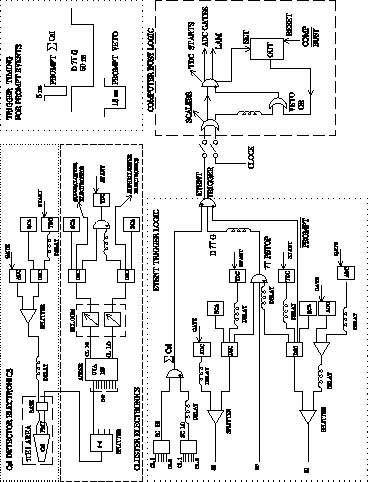
Figure: The
electronic diagram for the  trigger.
The upper and lower discrimination levels were 25 and 3 MeV respectively: this meant
that
trigger.
The upper and lower discrimination levels were 25 and 3 MeV respectively: this meant
that  of the accidental Michel events were cut away in the trigger. The delayed
pion gate was opened 15 ns after a valid pion stop.
of the accidental Michel events were cut away in the trigger. The delayed
pion gate was opened 15 ns after a valid pion stop.
As previously mentioned, the endpoint of the Michel spectrum had been used for gain
calibration of the CsI detectors, and the prompt events provided a timing calibration
and a reliable way to time in various signals. The delayed muon gate D G was also
initiated by the stopped pion but delayed by
G was also
initiated by the stopped pion but delayed by
about 250 ns with respect to the pion stop time.

Table: The rates measured during the taking at an average proton
current of  . The computer live time was
  .
.
As displayed in figure , 250 ns after the pion stop time, the number of
 events was negligible and the D
 G was only
sensitive to Michel events. The temporal distributions (shown in figure )
of
G was only
sensitive to Michel events. The temporal distributions (shown in figure )
of  and Michel events are given by the following
relations respectively:
and Michel events are given by the following
relations respectively:
and
where  is the rate of pion stops,
  is the fraction of
solid angle subtended by the CsI array,
is the fraction of
solid angle subtended by the CsI array,  is the delay of
D
is the delay of
D G with
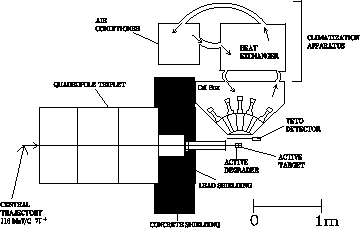
Figure: The experimental arrangement for
the study of  decays.
respect to the pion stop time (t=0),  is the length of the
delayed pion gate,
is the length of the
delayed pion gate,  and
and
 are the mean lifetimes of the pion and
muon respectively, and
are the mean lifetimes of the pion and
muon respectively, and
 is
the
is
the  branching ratio. Some of the measured rates
are compiled in table . The expected trigger rate (102 Hz) was the
fraction of
branching ratio. Some of the measured rates
are compiled in table . The expected trigger rate (102 Hz) was the
fraction of  with energies above the upper discrimination level of
 . The rate of
  in the CsI
array was given by equation . The explicit calculation gave
in the CsI
array was given by equation . The explicit calculation gave
 , consistent with the on-line observations.
A cut on the energy spectrum of the plastic veto detector in front of the CsI not
only eliminated the very energetic hadronic interactions but also some of the double
Michel events  . The double Michel
processes
form a broad energy spectrum extending up to
. The double Michel
processes
form a broad energy spectrum extending up to  with the most
probable energy close to the
with the most
probable energy close to the  peak. The
suppression of these events dictated the need for the two cylindrical MWPC's with
double track resolution as explained in chapter 5. However, the test run of 1994 was
not equipped with MWPC's. As a result, the measured
peak. The
suppression of these events dictated the need for the two cylindrical MWPC's with
double track resolution as explained in chapter 5. However, the test run of 1994 was
not equipped with MWPC's. As a result, the measured
 spectrum shown in figure rides on
some double Michel background which was not cut away by the plastic veto detector
alone. The reduction of the beam intensity by a factor of three resulted in an
additional suppression of the double Michel events by a factor of ten.
spectrum shown in figure rides on
some double Michel background which was not cut away by the plastic veto detector
alone. The reduction of the beam intensity by a factor of three resulted in an
additional suppression of the double Michel events by a factor of ten.
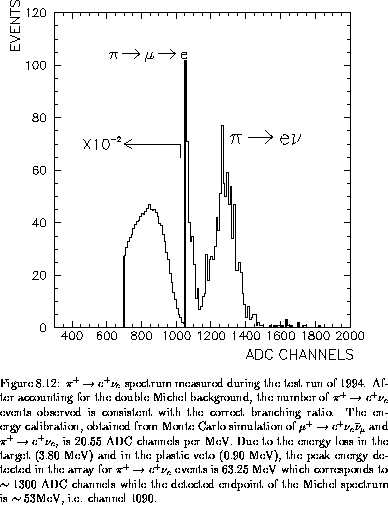
The measured
 spectrum is well separated from the Michel
background and the resolution could be improved by compensating for the energy
dispersion in
spectrum is well separated from the Michel
background and the resolution could be improved by compensating for the energy
dispersion in  due to the energy losses of the positrons in the
target and the plastic veto. To that end, two ADC inputs were implemented for the
target S2 and the degrader S1. One of the ADC inputs was in time with the trigger
while the other was delayed. The delayed ADC inputs measured the charge which
preceded the pulse in time with the trigger and allowed full energy reconstructions
in S1 and S2 signals. The energy scales for the degrader and the target were
absolutely calibrated using the measured peak positions of the light outputs in S1
and S2 and the expected energies deposited in these counters by the beam positrons,
muons and pions. Electron equivalent energies [Mad-78] were used in the calibration
for muons and pions. For the degrader S1, the fully reconstructed energy was used
to identify the beam particle which preceded the event. On the other hand, for the
target S2, the reconstructed energy was used to identify the Michel events from
due to the energy losses of the positrons in the
target and the plastic veto. To that end, two ADC inputs were implemented for the
target S2 and the degrader S1. One of the ADC inputs was in time with the trigger
while the other was delayed. The delayed ADC inputs measured the charge which
preceded the pulse in time with the trigger and allowed full energy reconstructions
in S1 and S2 signals. The energy scales for the degrader and the target were
absolutely calibrated using the measured peak positions of the light outputs in S1
and S2 and the expected energies deposited in these counters by the beam positrons,
muons and pions. Electron equivalent energies [Mad-78] were used in the calibration
for muons and pions. For the degrader S1, the fully reconstructed energy was used
to identify the beam particle which preceded the event. On the other hand, for the
target S2, the reconstructed energy was used to identify the Michel events from
 decays as shown in figure : in
fact, the cascades
decays as shown in figure : in
fact, the cascades  were expected to deposit an
additional 4.118 MeV in the target relative to the
were expected to deposit an
additional 4.118 MeV in the target relative to the  events due to muon stops.
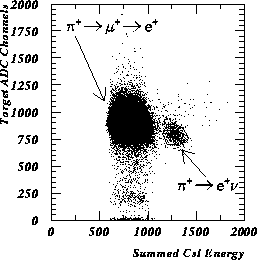
Figure: The separation between
Michel decays and the  events. The mean energy of the
Michel events in the target is higher by
events. The mean energy of the
Michel events in the target is higher by  than that of the
 events due to the 4.118 decay muons.
Therefore, the correlations between the full target energy and
 (triggered on one of the crystals for better energy resolution
and cut on positrons in the plastic veto detector) revealed two groups of particles
with one group having
(triggered on one of the crystals for better energy resolution
and cut on positrons in the plastic veto detector) revealed two groups of particles
with one group having  --- this result is obtained from the
absolute calibration and the energy distribution of the active target cut on
Michel and
--- this result is obtained from the
absolute calibration and the energy distribution of the active target cut on
Michel and  events in the CsI array --- more
than the other group in S2.
events in the CsI array --- more
than the other group in S2.

Figure: The measured pion decay curve versus expectation (dashed line).
The expected light output from the 4.118 MeV muons in target was  in agreement with measurement.
The goal of the test was to measure the response of the calorimeter to
 decays. In that respect, the test run was very
instructive and encouraging. The result of figure shows a clean
separation between the Michel and the
decays. In that respect, the test run was very
instructive and encouraging. The result of figure shows a clean
separation between the Michel and the  events.
The resolution will certainly be improved with the elimination of the double Michel
events using MWPC's with good double track resolution. From the measurements of
the responses of the array to monoenergetic positrons, electrons, and
events.
The resolution will certainly be improved with the elimination of the double Michel
events using MWPC's with good double track resolution. From the measurements of
the responses of the array to monoenergetic positrons, electrons, and
 decays, it can be concluded that the pion beta
shower calorimeter, operated under controlled temperature and humidity and equipped
with excellent CsI modules with good surface treatment, is capable of detecting
decays, it can be concluded that the pion beta
shower calorimeter, operated under controlled temperature and humidity and equipped
with excellent CsI modules with good surface treatment, is capable of detecting
 decays with good energy and timing resolutions
which are necessary to isolate this process from the background. The other reaction
of interest to the pion beta experiment is the pion beta decay. This process
ultimately produces two photons of
decays with good energy and timing resolutions
which are necessary to isolate this process from the background. The other reaction
of interest to the pion beta experiment is the pion beta decay. This process
ultimately produces two photons of  which are expected to be
detected in the shower calorimeter. It has therefore been necessary to check the
response of the calorimeter to photons of similar energies. Such photons were produced during the test run of 1994 via the charge exchange reaction
which are expected to be
detected in the shower calorimeter. It has therefore been necessary to check the
response of the calorimeter to photons of similar energies. Such photons were produced during the test run of 1994 via the charge exchange reaction
 , and the data are currently being analyzed.
With the number of  decays measured and the number
of pions stopped in target, an estimate of the branching ratio
decays measured and the number
of pions stopped in target, an estimate of the branching ratio
 can be made. It should be stressed that the
measurement of the branching ratio
can be made. It should be stressed that the
measurement of the branching ratio  was not the goal
of the test run and as a result, the experiment was not fully equipped for a precise
determination of
was not the goal
of the test run and as a result, the experiment was not fully equipped for a precise
determination of  . Of the
  particles stopped in the target,
  were pions and

 decays were registered
in the array. Taking into account the fraction of solid angle
decays were registered
in the array. Taking into account the fraction of solid angle  subtended by the array, the fraction of pions still alive at the time the delayed
pion gate is opened (0.56), and correction factors such as the computer live time
(
subtended by the array, the fraction of pions still alive at the time the delayed
pion gate is opened (0.56), and correction factors such as the computer live time
( ), positron annihilation
  , shower backsplash
  , and the
veto inefficiency
, and the
veto inefficiency  , the estimated branching ratio is
  .
.